CASPIAN SEAL AERIAL SURVEY
Caspian International Seal Survey (CISS)
and
Kazakhstan Centre for Fisheries Production and Research (FRPC)

Survey objectives
The principal survey objective is to obtain a reliable estimate in successive years of Caspian seal pup production and from this to determine trends in the size of the breeding population. In the Caspian, snow cover on the ice is usually insufficient for mothers to excavate lairs to hide their pups, and therefore most pups are born on to the exposed ice surface, where they are visible from an aircraft. The principal aim of the Caspian survey is therefore to count pups and thereby estimate total pup production on the north Caspian ice. Although all seals on the ice are counted. Survey flights are carried out between about February 18-27, when all pups are expected to have been born.
Other objectives are to determine breeding seal distribution on the ice, to relate this to ice-formation patterns and to assess the impact of human activities on breeding seals.
Aerial survey aims
The specific aims of the aerial survey are to determine:
The number and distribution of seal pups on the winter ice-field
The number and distribution of mothers and other seals on the winter ice-field
The number and distribution of eagles and other predators (such as wolves) on the winter ice-field
The number of seal pups and other seals born on ice-free islands in the north Caspian
Aerial survey rationale
The aim of the survey design is to sample the entire ice surface in a non-biased manner, from the ice edge in the south to as far north, east and west as there is sufficient water depth beneath the ice to form suitable seal habitat. Thus the design is completely independent of the densities of seal groups or their suspected distribution. Detailed ice maps and bathymetric charts need to be studied immediately before the survey in order to plan transects to cover all appropriate ice areas.
A strip transect technique is used. This was originally developed for surveys of Baltic ringed seals (Härkönen and Heide-Jörgensen, 1990). A small, high-winged aeroplane is flown on evenly-spaced transects at constant height and speed. Transect strips are designed so that a minimum of 10% of the ice is surveyed. An altitude of 90m is chosen, since this gives adequate resolution of seals on the ice for both visual observation and photography. The strip surveyed on each transect is divided into 400m on each side of the aircraft, making a total transect of 800m wide. All seals within the 400m strips are counted both visually and from photographs.
The transects follow evenly spaced longitudes with an inter-transect distance of six longitudinal minutes; thus the required 11% coverage of the ice surface is achieved. Alternate transects are flown from north to south and from south to north such that entire range of the potential seal habitat in the ice area is covered (Fig. 1).
Figure 1. Example of transects flown for the aerial survey in the northern Caspian.
Flying 800m strips at six longitudinal minutes apart result in a total survey fraction of 11% of the total ice area of ice habitat for seals. Past work indicates that survey fractions of around 11% give the optimal balance between precision and survey effort, since increasing the survey fraction above this figure does not yield significantly improved precision (Härkönen & Lunneryd 1992).
The aeroplane used should be twin-engined for safety, and high-winged, so there is a clear view of the ice under the wings, and the plane should be capable of flying at low altitude and a relatively slow speed. In Kazakhstan the aeroplane currently used is an L410, which permits a clear view of the ice surface beneath the wings. This aircraft is flown along the transects at 250 km/hour, while the altitude is maintained at a constant 90 m by means of a radar altimeter. The 400m strip on each side of the aircraft is viewed through specially marked windows (Fig. 1). This aircraft has double panes about five cm apart, which make it possible to mark sighting angles using marks on both the outer and inner windows. Inclinometers are used to find the sighting angles at 10.2deg (500m distance from the aircraft) and 46deg (100m distance) for each side of the aircraft and for each observer. Thus, the 200 m wide strip under the aircraft is not surveyed.
Four trained observers, two at each side of the aircraft, each viewing through marked windows, make visual counts of pups, mother-pup pairs, and seals older than pups during the entire survey. Visual observations are recorded either on paper or on Dictaphone. One of the observers on each side also takes digital photos of groups of seals for these to be counted later (Fig. 2)

Figure 2. Digital photo taken from the aircraft at 90 m
The geographical position of each observed seal or group of seals is noted by each observer marking a waypoint on a hand-held GPS unit. All eagles and wolves on the ice are also counted.
Ideally transect flights should be carried out both in Kazakhstan and Russian territory in order to cover the entire potential breeding area for the Caspian seal. Where it is not possible to fly in Russian, however, the relatively small number of pups that could be born in the Russian sector may be extrapolated from the known ice conditions. Where the structure of the ice (i.e. ice formed over a water depth exceeding 1 m) indicates the possibility of significant numbers of seals, the numbers in Russia may be estimated by mirroring the planned transects on the Russian side to the Kazakh side.
Data treatment
All waypoints marked are later downloaded to a computer spreadsheet file, after which each observer inserts their notes. The most detailed information for each waypoint is used as an estimate of numbers of seals of different categories, e.g. if one observer notes five seals, and the other notes a mother-pup pair and three older seals, the more detailed data are used. Photographs are used to count groups of seals more accurately than visual observations. The observations from the port and starboard sides are then merged to produce a total count for each 800 m strip. Finally, the total numbers of pups, mothers, other adults, eagles and wolves are totalled over all the strips. An estimate for the breeding female population size in each year is obtained by dividing the total numbers of pups counted by 0.11, since the survey fraction is 11%.
Each transect was divided into 4 km2 segments, obtained by dividing each 800m transect into five km long segments. These segments form the basic units for carrying out further analyses:
(a) To map seal density distribution in each year. Density distribution is shown as the mean number of animals/km2.
(b) To calculate the coefficient of variation (CV) of the numbers of adults, pups and predators. This is computed by using the basic data to create distribution maps of all categories of counted animals. By rotating the positions of the original transects at random angles 100 hundred times, 100 replicate estimates are achieved. The mean density and its variance, will give an unbiased estimate of the CV, which is the variance as a percentage of the mean.
(c) Comparisons of the numbers of adults and pups in successive years.
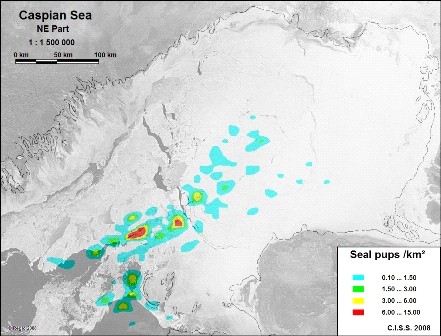
Figure 3. Example of pup distribution derived from the survery data.
Supplementary flights
Supplementary flights in either a fixed-wing aeroplane or a helicopter may be used to determine (a) the presence of seals on ice-free islands or shoreline, and (b) the approximate limits of seal distribution before transects are defined. In these cases sighting angles on the aircraft windows are not necessary. In the case of ice-free shorelines, the entire shoreline should be surveyed and all seals photographed and GPS locations noted. In the case of a pre-transect survey, the approximate numbers and GPS locations of adults and pups close to the margins of potential distribution may be noted; this helps in some cases to plan transect limits.
Estimation of total population size
The ice survey described here is intended to estimate the annual pup production and hence size of the Caspian seal breeding female population.
The annual pup production estimate from this survey, which takes place approximately at the end of the birthing period, is an estimate of potential juvenile recruitment into the population. This recruitment may be potentially reduced post-survey by hunting, eagle or wolf predation, fisheries by-catch, premature ice-melt, disease or other factors.
The breeding population includes actively breeding females, other potentially active breeding females (Caspian seal females may not breed every year), fertile males and juveniles of both sexes. Probably because of organochlorine contamination in the Caspian, a significant number of seals may be permanently infertile. The total size of the female population of Caspian seals may be given by the equation
N =P/F*A
Where N if the total female population size (including juveniles and both fertile and non-fertile adults), P = the number of pups estimated from the ice survey, F is the adult female fertility rate and A is the adult share of the total female population. If F is set at 0.5 (each adult female on average breeding every second year) and A is estimated at approximately 0.7 (Härkönen et al., 2005), an approximate figure for N, the total number of females, may be calculated using the number of pups estimated from each population survey. 2N would be the total population size for the Caspian seal. However, the following caveats should be noted:
If the fertility rate F is actually higher than 0.5, the total population size will actually be smaller than that calculated. If F is actually lower than 0.5, the total population size will actually be larger, but will consist of many infertile animals which can make no contribution to the future of the population.
The number of pups P counted in the annual survey may vary each year due to (a) high pup mortality possibly due to storms or unstable ice before the survey dates, (b) annual fluctuations in birth rate due to environmental or disease factors, or (c) Highly clustered distribution of pups in some years leading to high CVs. Therefore a moving average figure for annual pup production – e.g. an average over 3 successive annual surveys – would give a more reliable total population estimate than relying on data from a single year.
The estimated adult share of the population, A, may change gradually and should therefore be re-evaluated every few years using the method of Härkönen et al (2005).
When considering the effects of juvenile mortality on population trends, it should be noted that the average generation time for Caspian seals is about 16 years, and individuals may breed for 40 years. There may therefore be a latent period of several years before the effects of either increasing or reduced juvenile mortality become evident in the annual pup production.
BIBLIOGRAPHY
Härkönen, T. & Heide-Jørgensen, M.P. 1990. Density and distribution of the ringed seal in the Bothnian Bay. Holarctic Ecology 13, 122–129.
Härkönen, T. & Lunneryd, S.G. 1992. Estimating abundance of ringed seals in the Bothnian Bay. Ambio 21, 497–510
Härkönen, T., Jüssi, M., Baimukanov, M., Dmitrieva, L., Kasimbekov, Y., Verevkin, M., Wilson, S.C. & Goodman, S.J. 2005. Population size and density distribution of the Caspian seal (Phoca caspica) on the winter ice field in Kazakh waters, 2005.Final report prepared for the Caspian Environment Programme, June, 2005. www.caspianenvironment.org